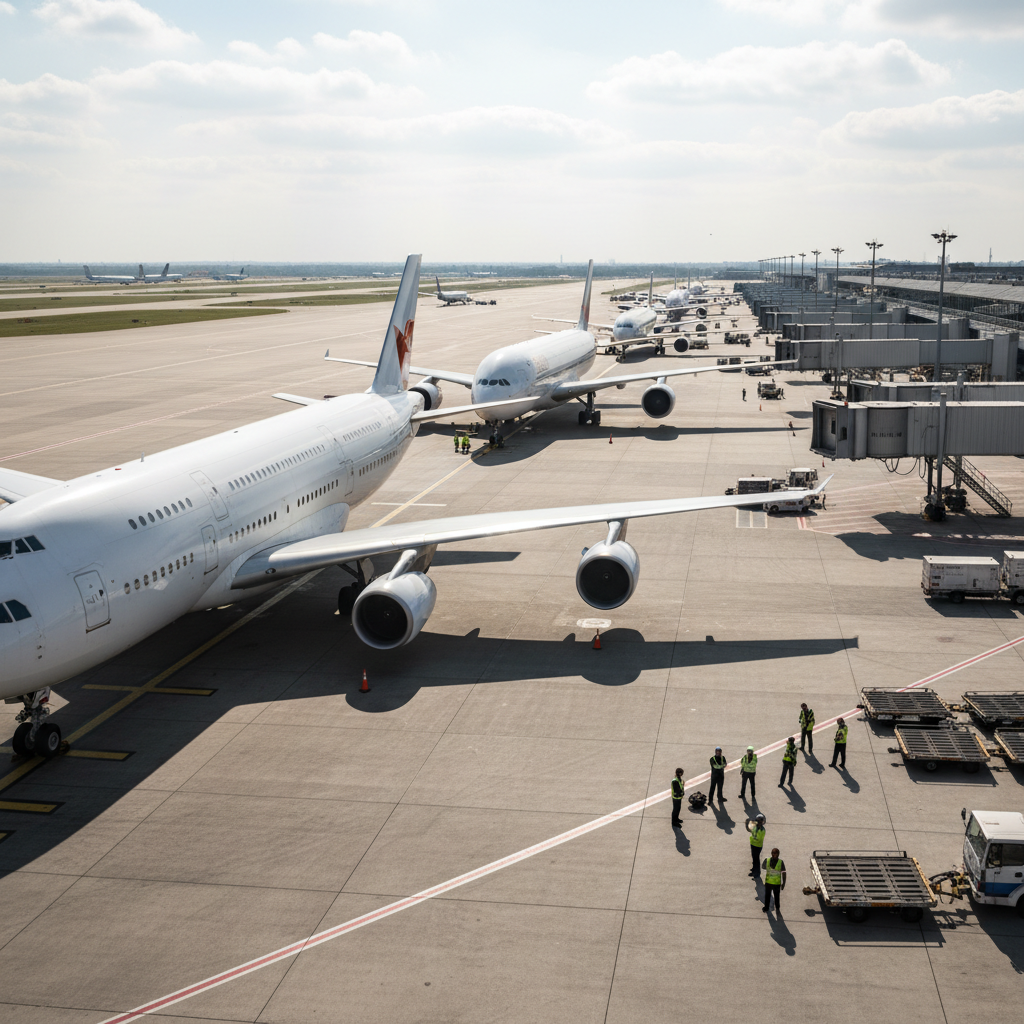
Chaotic airport ramp with queuing aircraft and idle ground crews
WITHOUT TARMAC
Avg Departure Delay
23min
Industry baseline · 2025
Gate conflict B12/B14
Pushback queue +8 min
3 crews unassigned
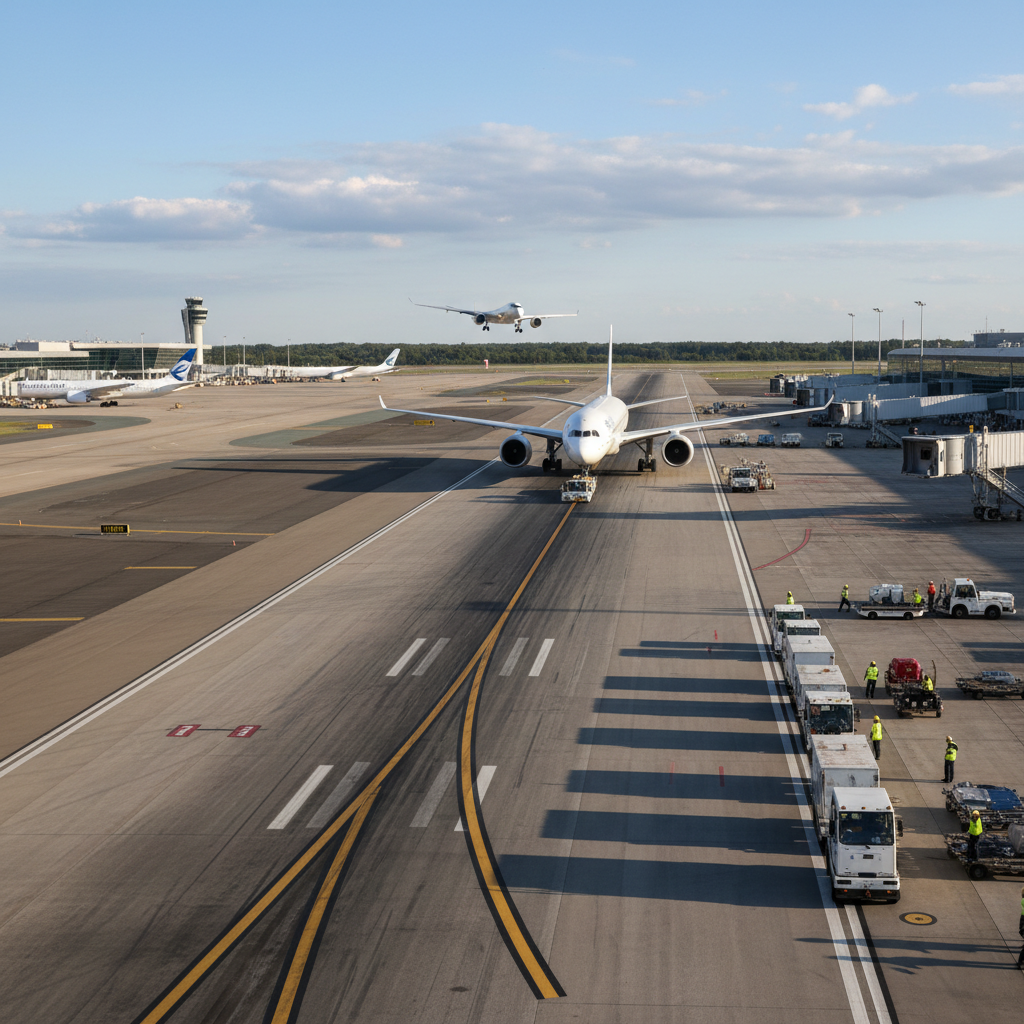
Airport runway with smooth aircraft sequencing and pre-positioned ground crews
WITH TARMAC
Avg Departure Delay
6min
Tarmac median · Q4 2025
Gates B12–B16 sequenced
Pushback on schedule
All crews pre-positioned
TARMAC ACTIVE▸ ATL · 412 MOVEMENTS TODAY▸ LHR · 387 MOVEMENTS▸ DXB · 362 MOVEMENTS▸ ORD · 341 MOVEMENTS▸ HND · 318 MOVEMENTSTARMAC ACTIVE▸ ATL · 412 MOVEMENTS TODAY▸ LHR · 387 MOVEMENTS▸ DXB · 362 MOVEMENTS▸ ORD · 341 MOVEMENTS▸ HND · 318 MOVEMENTSTARMAC ACTIVE▸ ATL · 412 MOVEMENTS TODAY▸ LHR · 387 MOVEMENTS▸ DXB · 362 MOVEMENTS▸ ORD · 341 MOVEMENTS▸ HND · 318 MOVEMENTSTARMAC ACTIVE▸ ATL · 412 MOVEMENTS TODAY▸ LHR · 387 MOVEMENTS▸ DXB · 362 MOVEMENTS▸ ORD · 341 MOVEMENTS▸ HND · 318 MOVEMENTS
← drag to compare →
01 · TURNAROUND EFFICIENCY
0 sec
saved per turnaround

Predictive gate allocation eliminates tow conflicts before they form. Tarmac reads inbound aircraft ETAs, crew availability, and gate adjacency simultaneously — assigning pushback windows that interlock without manual intervention. At 400 daily movements, 114 seconds compounds into 12.7 hours of recovered capacity every single day.

LEGACY OPERATIONS
Gate assignment process
Operations controller manually reviews display board. Calls ramp supervisor. Supervisor dispatches crew. Average 8–14 minutes from inbound confirmed to gate locked.
Conflict detection
Tow conflicts discovered on the ramp. Aircraft halted. Crew reassigned. Window missed. Cascade begins.
Daily impact
0.2 conflicts/day
TARMAC PLATFORM
Gate assignment process
Tarmac ingests ACARS data 22 minutes before landing. Gate pre-assigned. Crew notified with 18-minute lead time. Zero phone calls. Average 0–45 seconds from confirmation.
Conflict detection
Conflicts modeled 40 minutes ahead. Pushback windows adjusted automatically. Nothing reaches the ramp unresolved.
Daily impact
0.3 conflicts/day
MetricLegacyTarmacΔ
Avg turnaround conflict4.2 per day0.3 per day−93%
Tow conflict detectionManual · 8–12 minAuto · 0 sec−100%
Crew pre-position accuracy61%97%+59%
Gate utilization rate68%91%+34%
02 · GATE UTILIZATION
91%
gate utilization · up from 68%

At 68% utilization, a 30-gate terminal hemorrhages the equivalent of 9.6 idle gates per day. Tarmac's predictive rotation engine closes that gap — scheduling ground time, cleaning crews, and fuel stops inside a unified 4-hour rolling window with zero manual dispatch calls.

LEGACY GATE BOARD
B12
74%
B13
71%
B14
!
B15
68%
B16
56%
B17
77%
B18
69%
B19
51%
Overall: 68% utilization
TARMAC GATE BOARD
B12
94%
B13
91%
B14
0%
B15
88%
B16
76%
B17
97%
B18
89%
B19
71%
Overall: 91% utilization
23min
Avg turnaround time saved
34%
Gate utilization increase
0 conflicts
Tow conflicts today
97%
Crew pre-position accuracy
03 · RUNWAY THROUGHPUT
+8
departures/hour
vs. unsequenced ops

Tarmac's runway sequencing engine calculates separation minima, wake turbulence categories, and taxiway transit times in parallel — building a departure queue that maximises runway occupancy without violating ATC constraints. The result: 38 departures per hour versus the 30-per-hour industry average at comparable airports.

Separation calculationController judgementAuto · 400ms
Wake turbulence pairingManual lookupReal-time AI pair
Taxiway routingStandard pathsDynamic conflict-free
Runway occupancy rate62%84%
Departure Sequence · Live
06:14 UTC
FlightTypeGatePushbackRWYStatus
AA1842B77WB1206:1406:22on-time
UA2291A321B1306:1706:26on-time
DL0447B738B1506:2006:29on-time
AA0891A319B1706:2306:32on-time
UA1104B752B1806:2606:35on-time
SW3310B737B1606:2906:38standby
6 OF 38 SCHEDULED · RWY 28L/28RSEPARATION OK ✓
38/hr
Departures per hour
vs. 30/hr industry avg
84%
Runway occupancy rate
vs. 62% unsequenced
400ms
Separation calculation
vs. controller judgement
04 · DELAY CASCADE REDUCTION
141→4
minutes of cascade eliminated

A single pushback conflict doesn't stay local. In unsequenced operations, one 14-minute delay cascades through gate rotations, crew reassignments, and next-wave departures — compounding to 141 minutes of total system disruption across 8 flights. Tarmac absorbs the initiating event before it propagates. The cascade never starts.

Turnaround conflict
14 min lost
1 min lost
93%
Gate ripple (3 gates)
42 min lost
1 min lost
98%
Crew reassignment
18 min lost
0 min lost
100%
Next-wave delay
67 min lost
2 min lost
97%
System cascade (8 flights)
141 min total
4 min total
97%
Legacy ops
Tarmac platform
Legacy — Daily cascade cost
$47,200
Per 400-movement day · delay penalties + idle crew + missed connections
Tarmac — Daily cascade cost
$3,800
Per 400-movement day · residual minor delays only
05 · RUN YOUR NUMBERS
Your airport. Your delay data. Your ROI.

Input your IATA code. Tarmac models your delay reduction against our benchmark dataset of 47 airports and 6.2 million movements.

LIVE SIMULATION
Awaiting IATA input
Minutes saved · daily
Est. annual savings
Enter your IATA code to generate a custom delay reduction model.
FULL BENCHMARK REPORT
47 Airports. 6.2M Movements. One Report.

The Tarmac 2025 Operations Benchmark covers turnaround efficiency, gate utilization, runway throughput, and cascade delay data across major hub and secondary airports. Used by ops directors at 12 of the top 50 busiest airports globally.

47-airport delay comparison matrix
Gate utilization percentile rankings
Cascade cost model by airport class
Tarmac implementation case studies (ATL, LHR, SIN)
ROI calculator methodology
No spam. One report. Used by 12 of the top 50 busiest airports.